Set Up Website, SSL, and Domain Monitoring in
3 Easy Steps
Step 1
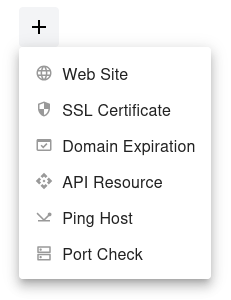
Open the dashboard, click the  button, and select Web Site from the dropdown menu.
Step 2
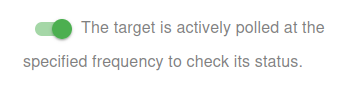
Choose whether to activate the monitor immediately or keep it paused for now:
- Active: The target is actively polled at the specified frequency to check its status.
- Paused: The target is temporarily inactive and will not be polled until set to active again.
Step 3
Set the Name and URL for your target. The Name will be used in alerts, reports, and other notifications.
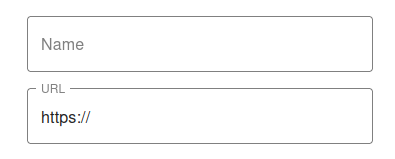

You have now set the minimum required settings to start monitoring your resource/target.
The next steps are optional.
If you click Save, our bots are ready to start scanning and monitoring your site
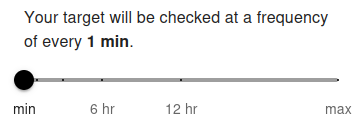
Scan Frequency (Up/Down Monitoring)
Your target will be checked at a frequency of every 5 min by default. The minimum allowed frequency is 1 minute and the maximum is 24 hours.
The scan frequency determines how often your website's availability is verified. Setting a shorter interval (e.g., 1 minute) allows you to detect downtime almost instantly. For free users, the minimum frequency is typically 5 minutes, while premium users can set it to 1 minute for near real-time monitoring. Frequent checks are useful for critical services and help ensure fast alerting.
Longer intervals (e.g., 1 hour or more) are suitable for less critical websites where instant notification is not necessary. Choose the frequency based on how quickly you need to respond to downtime and the importance of the monitored resource.
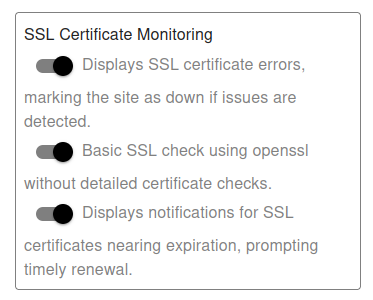
SSL Certificate Monitoring
Choose whether SSL certificate scanning is Active or Inactive:
- Active: Displays SSL certificate errors, marking the site as down if issues are detected.
- Inactive: Ignores all SSL certificate errors during site/domain pinging.
Choose the SSL check type:
-
Basic: Basic SSL check using
opensslwithout detailed certificate checks. - Advanced: Advanced SSL check with detailed certificate and status verification.
SSL Certificate Expiration Notifications (optional):
- Enable: Displays notifications for SSL certificates nearing expiration, prompting timely renewal.
- Disable: Suppresses all SSL certificate expiry notifications.
Note: This option is optional. For basic Up/Down monitoring over HTTPS, SSL expiry notifications are not required. You can create a separate monitor specifically for SSL certificate expiration alerts if needed.
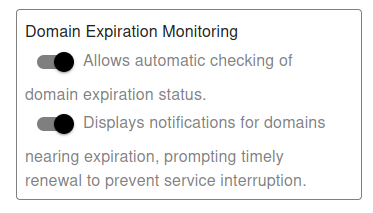
Domain Expiration Monitoring
Choose whether to enable automatic domain expiration checking:
- Enable: Automatically checks your domain's expiration date and tracks it to ensure you never miss renewal deadlines.
- Disable: Skips checking this domain for expiration. Use this option if the domain does not require active monitoring.
Control domain expiration notifications to receive timely alerts:
- Enable Notifications: Displays alerts for domains nearing expiration, prompting timely renewal to prevent service interruption.
- Disable Notifications: Suppresses all domain expiration notifications. Use this option only if you track renewals manually or through another system.
Domain Expiration Monitoring helps you stay on top of renewal dates and ensures your website, email, and other domain-based services remain uninterrupted. By enabling both domain checks and notifications, you reduce the risk of unexpected downtime and maintain continuous control over your domains.
Advanced Settings
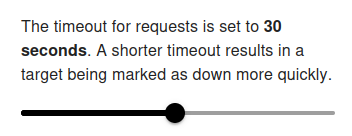
The request timeout
The request timeout defines how long our monitoring bots will wait for a response from your server before marking the target as down.
Default: 30 seconds
Range: 1 – 60 seconds
Setting a shorter timeout means your target can be marked as down more quickly if responses are slow. This is useful if you want immediate alerts, but using too low values (like 1–5 seconds) may cause false positives, especially during traffic spikes or heavy server load.
Choosing a longer timeout (e.g., 45–60 seconds) makes monitoring more tolerant of slow responses, but it will also delay downtime detection and notifications.
👉 For most cases, we recommend keeping the default 30 seconds for a good balance between speed and reliability.
Redirect Handling
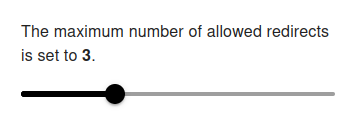
The maximum number of allowed redirects defines how many times our monitoring bots will follow HTTP 3xx redirect responses before stopping.
Default: 3
Range: 0 – 10
- If set to 0, redirect following is completely disabled.
In this case, if your server responds with a 3xx status code, it will be returned as-is, and the target may be marked as down depending on your monitoring rules.
- With a low value (e.g., 1–2), only a few redirects are allowed. This is useful if you want strict control and faster detection of redirect loops.
- With a higher value (up to 10), more redirects will be followed, which is useful for complex setups where a request may pass through multiple load balancers, CDNs, or authentication redirects. However, too high a value may slow down checks or hide misconfigurations.
👉 For most cases, we recommend keeping the default 3, which provides a balance between flexibility and reliability.
Successful HTTP Response Codes
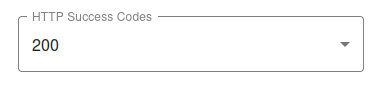
You can configure which HTTP status codes should be considered a successful response for your target. By default, 200 - OK is used, but you may choose other codes depending on your use case.
- 200 – OK
- 201 – Created
- 202 – Accepted
- 203 – Non-Authoritative Information
- 204 – No Content
- 205 – Reset Content
- 206 – Partial Content
- 207 – Multi-Status (WebDAV)
- 208 – Already Reported (WebDAV; RFC 5842)
- 226 – IM Used (RFC 3229)
- 300 – Multiple Choices
- 301 – Moved Permanently
- 302 – Found
- 303 – See Other (HTTP/1.1)
- 304 – Not Modified
- 305 – Use Proxy (HTTP/1.1)
- 306 – Switch Proxy
- 307 – Temporary Redirect (HTTP/1.1)
- 308 – Permanent Redirect (RFC 7238)
👉 For most monitoring cases, 200 is the standard choice. However, if your service legitimately returns other codes (e.g., 301 or 302 for redirects), you can mark them as successful to avoid false "down" alerts.
Request Mode
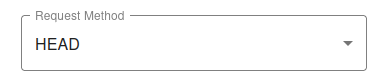
You can choose the HTTP request method our monitoring bots will use when checking your target. The default method is HEAD, which is the most efficient in most cases.
- HEAD (default) – Sends only the request headers without downloading the full content. ⚡ Fast and lightweight, recommended for most uptime checks.
- GET – Retrieves the full page content along with headers. Useful if you want to confirm that the actual content is served, but it requires more bandwidth.
-
POST – Sends data to the server, typically used for forms or API requests.
Recommended only for advanced use cases where your endpoint expects a POST request.
When this method is selected, an additional field appears where you can enter arequest bodyin JSON format. This allows you to define custom payloads to be sent with the monitoring request. - OPTIONS – Requests the supported communication options from the server. Mostly used for testing or debugging API endpoints (e.g., CORS preflight checks).
👉 For uptime monitoring we recommend keeping the default HEAD method. Switch to GET if you specifically want to validate page content, or use POST/OPTIONS for custom API monitoring scenarios.
Content Type & Response Accept
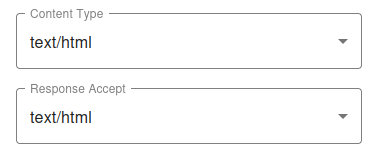
These settings let you control how requests are sent and what type of responses are expected. By default, both are set to text/html, which is suitable for most website monitoring.
-
Content-Type – Defines the format of the data being sent in the request.
text/html(default) – Standard web pagestext/csv– For CSV-formatted request bodiesapplication/json– For JSON payloads, commonly used in APIs
-
Response Accept – Defines the type of content your monitoring bot expects to receive back.
text/html(default) – Standard web page responsestext/csv– For CSV-formatted responsesapplication/json– For API responses returning JSON
👉 In most cases, you can keep both settings as text/html. Switch to application/json if you are monitoring an API endpoint, or text/csv for CSV-based services.
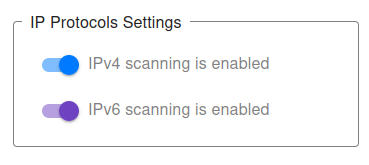
IP Protocols Settings
You can choose which IP protocols to use when monitoring your target. By default, both IPv4 and IPv6 are allowed, and the monitoring bot will decide automatically which protocol to use.
-
IPv4 only – All requests will be sent using IPv4.
Example:
http://1.2.3.4(an IPv4 address) will only allow IPv4 checks. -
IPv6 only – All requests will be sent using IPv6.
Example:
http://[2001:db8::1](an IPv6 address) will only allow IPv6 checks. - IPv4 + IPv6 (default) – Both protocols are supported, and monitoring will work for any valid hostname or IP address.
👉 If you provide a direct IP address in the URL, the system automatically restricts monitoring to that protocol type (IPv4 or IPv6).
👉 For hostnames (e.g., example.com), you may explicitly choose to monitor only via IPv4 or only via IPv6.
This can be useful for:
- Testing whether your service is accessible via both protocols.
- Ensuring IPv6 readiness before migration or deployment.
- Debugging connectivity issues specific to one protocol type.
For most cases, we recommend keeping the default (IPv4 + IPv6) setting, ensuring maximum compatibility and availability.
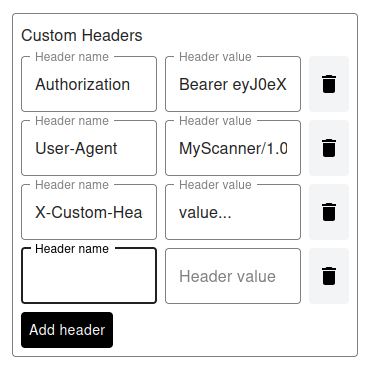
Custom Headers
This setting allows you to add custom HTTP headers to each request. Headers are specified as key-value pairs.
Examples of usage:
Authorization: Bearer <token>– for access control.User-Agent: MyScanner/1.0– to identify your monitoring tool.X-Custom-Header: value– for specific backend services or custom logic.
Key points:
- Any number of custom headers can be added.
- If a header conflicts with system headers (e.g.,
Content-TypeorAccept), the user-defined value takes precedence. - Custom headers allow you to emulate different client behaviors or bypass server restrictions.
✅ Default: none. You only need to add headers if your endpoint requires them.
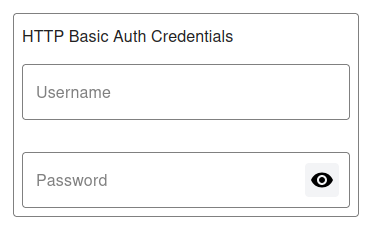
HTTP Basic Auth Credentials
This setting allows you to provide a username and password for HTTP Basic Authentication. It is used when your target requires authentication to access the content.
Usage notes:
- Enter the Username and Password exactly as required by your server.
- The credentials will be sent securely with each monitoring request using HTTP Basic Auth headers.
- Make sure to use valid credentials to avoid false "down" alerts.
✅ Default: none. Leave empty if your target does not require authentication.
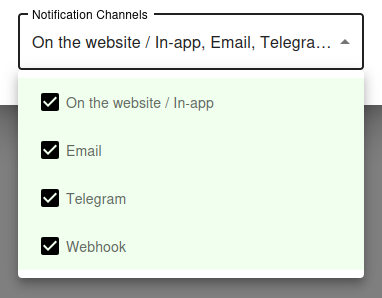
Notification Settings – Choose how you want to receive alerts
How would you like to be notified?
By default, all available notification channels are enabled:
- On the website / In-app
- Telegram
- Webhook
You can customize which channels to use for this monitor individually, or globally manage permissions for Email, Telegram, and Webhook notifications via your Notification Channels settings.
✅ Recommended: Keep all channels enabled for maximum awareness of uptime issues, but adjust according to your preferences and workflow.